Goal: Predict the winner of Jeopardy. As the game progresses, update the predictions to take into account the current score profile.
Background: A quick search revealed work by The Jeopardy Fan on building a model to predict the Tournament of Champions contestants. He used player’s Coryat scores to predict the length of their winning streak, and whether they would qualify for the tournament. I’m going for something slightly different than him by focusing on predicting the winner of a single game. I’m also going to use the real game score, instead of Coryat scores.
Data: The J-Archive is an incredible resource for Jeopardy! data, thanks to the work of their archivists. They have every game ever played, every question asked, along with which contestants answered and whether they were correct or not. I downloaded data from seasons 22-33 for fitting and testing the models.
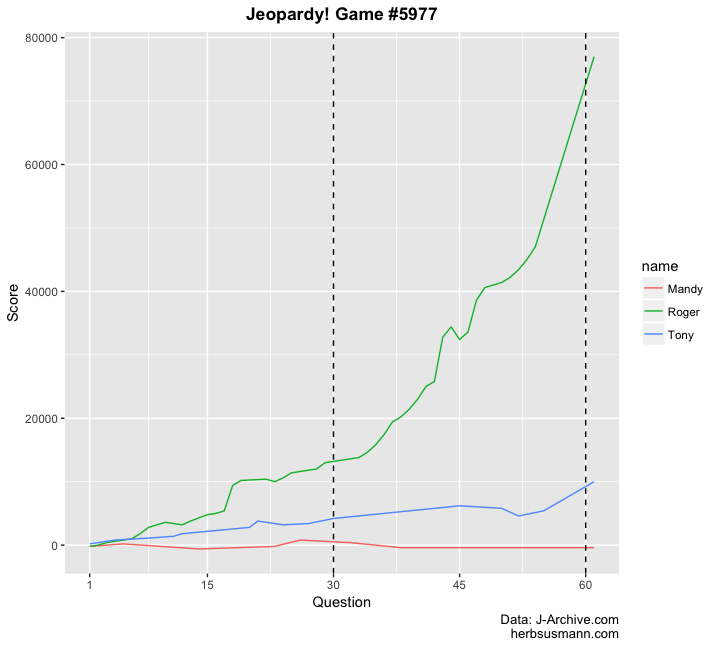
Intuition: Let’s explore the dataset a little bit to get a sense of how we might build a classification model to predict winners. You can easily make plots that show how a contestant’s score changes over the course of a game, like this one that shows Roger Craig setting a one-day earnings record:

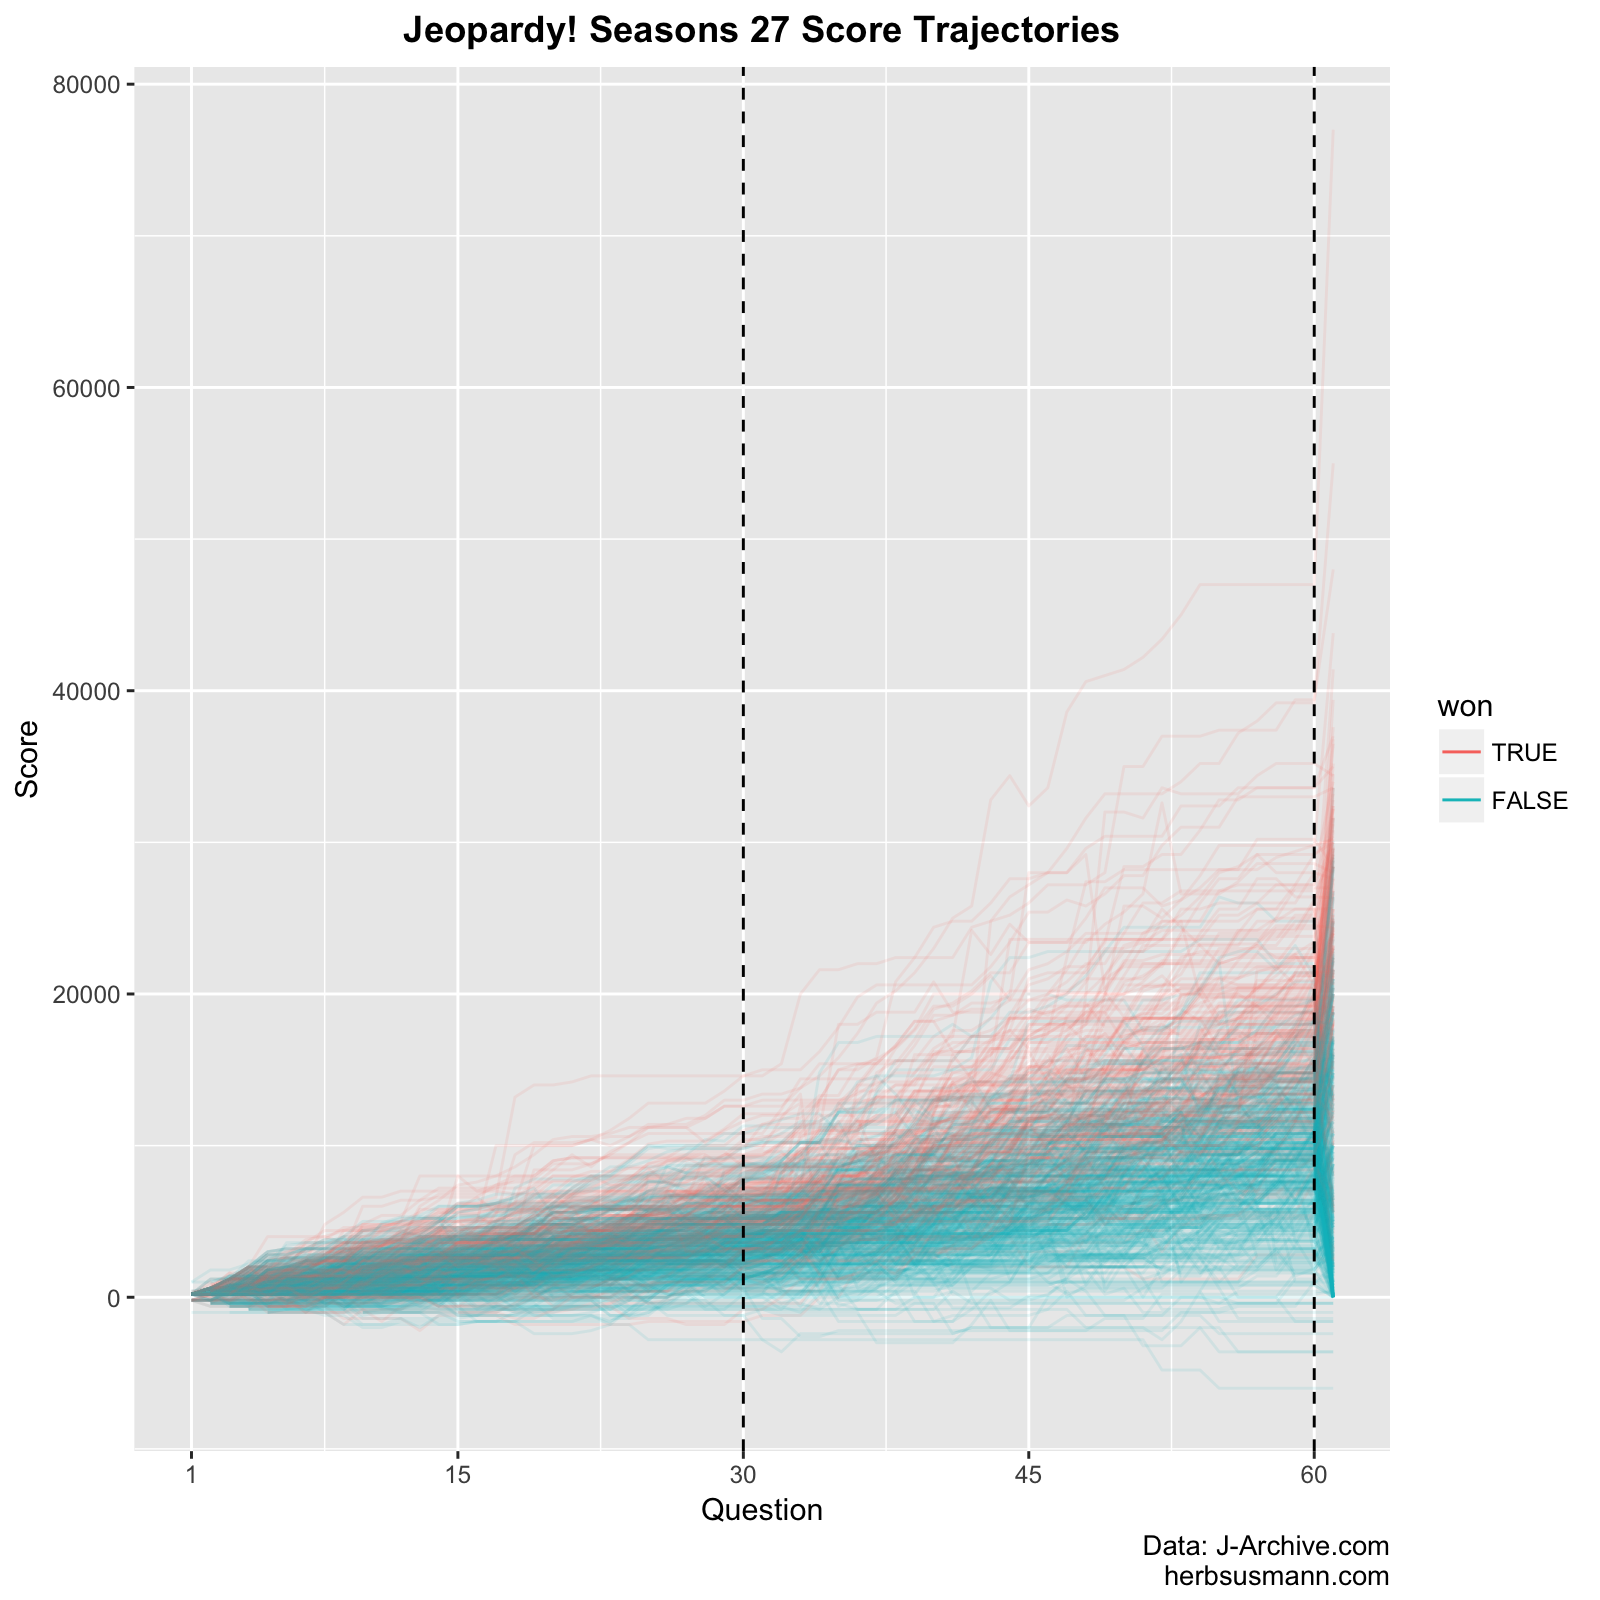
Expanding this type of plot beyond a single game, here is a plot showing all of the games from season 27, with each trajectory colored by whether the contestant won the game:

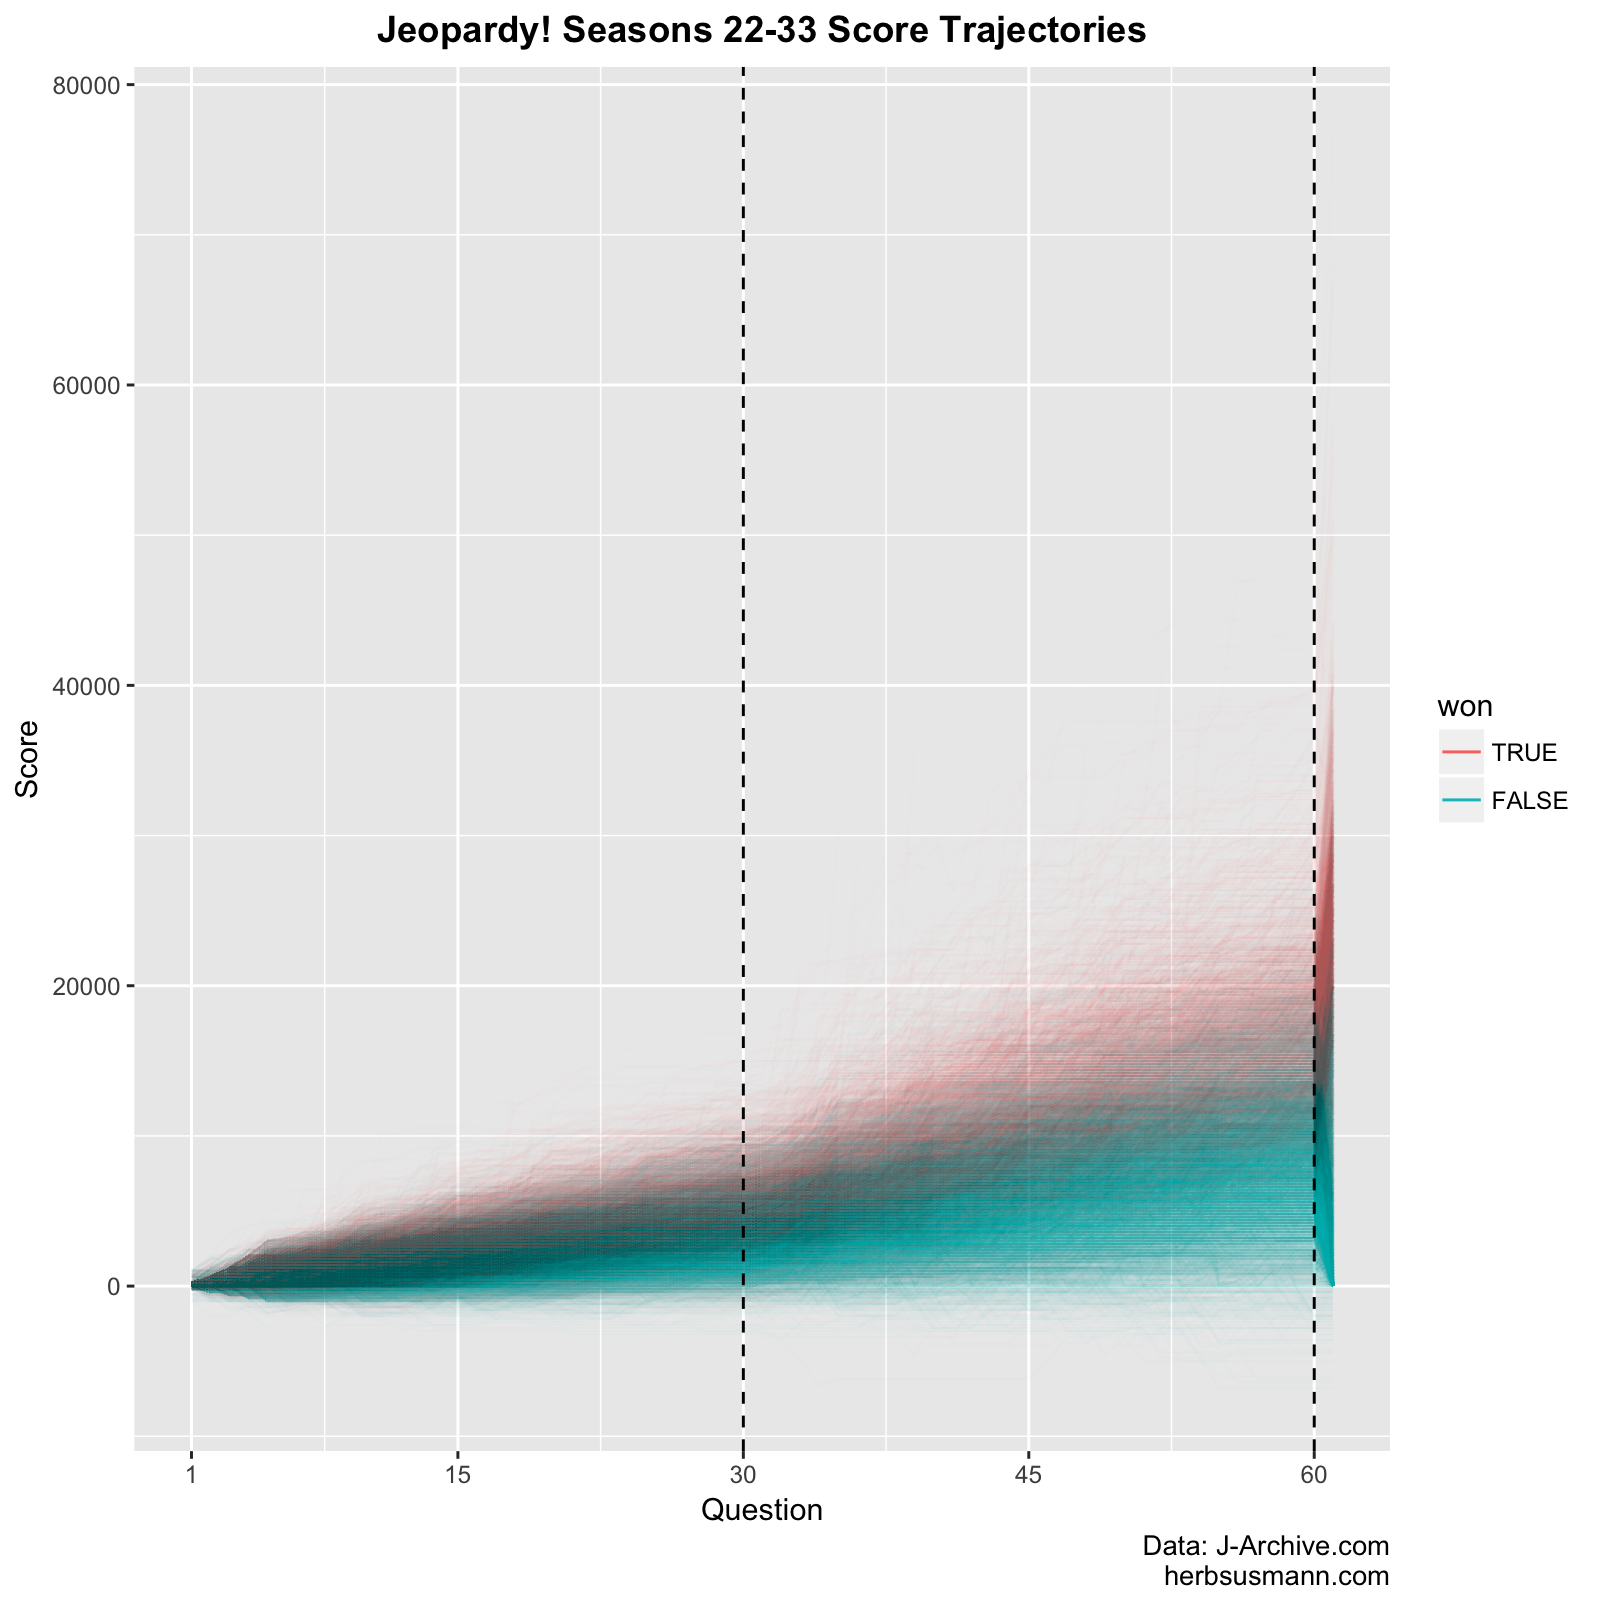
The winners tend to have higher scores throughout the game, but you can still see a few people who had high scores and still lost. If we show more seasons at once we can see more of the overall trend, but we lose the ability to see individual trajectories clearly:

Another way to look at this is by plotting the median scores, with a ribbon showing the 5% and 95% quantiles:

It looks like there is some separation between the winners and losers just in terms of their score, and the separation becomes more pronounced as the game progresses, which a model should be able to pick up on and use for prediction.
We should temper our expectations, though. Especially in the first graph, you can see how much of a randomizer the Final Jeopardy round is. Here’s a table showing how the contestant’s rank going in to Final Jeopardy corresponds to winning or losing (data from seasons 22-33):
| Rank | Won | Lost |
|---|---|---|
| Third | 171 (6%) | 2554 (94%) |
| Tied for second | 8 (12%) | 60 (88%) |
| Second | 591 (22%) | 2116 (75%) |
| Tied for first | 17 (47%) | 19 (53%) |
| First | 1991 (73%) | 750 (27%) |
27% of contestants in first place going in to Final Jeopardy still lose. It’s going to be very difficult to accurately predict when an upset will happen, so this gives us a sense of the limits of any prediction model.
Modeling and Results: One of the goals is to predict the winner as the game progresses. In each game of Jeopardy! there are up to 61 questions: 30 in Single Jeopardy, 30 in Double Jeopardy, and 1 in Final Jeopardy. I decided to fit a logistic regression model after every question, so we can see how the classification accuracy improves as the game gets closer to the end.
I used data from seasons 22-32 for training, and held out season 33 for testing.
There are 61 questions in each game; call them \(q_{1},q_{2},...,q_{i},...,q_{61}\), where \(q_{1}\) is the first question asked in the game, \(q_{2}\) is the second, and so on. The actual point value of each question might be different, depending on the order they are chosen in the game (for example, \(q_{1}\) might be a $200 question in one game, and a $1,000 question in another.) I fitted 61 logistic regression models \({M_{1}, M_{2}, ...,M_{n}}\) that predict whether the player won the game based on their score at the end of question \(i\). We would expect model \(M_{1}\) to do poorly, because the first question isn’t very informative of who is going to end up winning; and the accuracy to improve as the game progresses.
For example, here is the fitted logistic model for question 30:

We can visualize the accuracy of the all models at once by plotting their ROC curves.

As we would expect, the model has lousy accuracy at the beginning of the game, but improves steadily as the game progresses. However, it is not perfect even after the game is over. This is because the score itself doesn’t determine the winner; what matters is who has the highest score.
To address this, I added two new features to bring in information about the contestants compare to each other within the game:
- rank - categorical variable indicating the contestant’s current rank (first place, tied for first, second place, etc.)
- distance from lead - the difference in points between the contestant and the leader. If the contestant is in the lead, it is a negative number indicating how far they are ahead.
I built two new sets of models using these features. I also added a very simple model for comparison: predict the winner of the game to be whoever is in the lead. This model doesn’t output probabilities, so it will show up on the ROC curves as a single point (I call this model “current leader” in the legend.) Here’s how they compare to the original model:

The new models aren’t that much better than the original model. The biggest difference I see is that they have perfect accuracy at the end of the game, as you would expect since they have access to the final ranking of the contestants.
The “current leader” reference model falls right on the curves, indicating the logistic models don’t do better than it. They may be more useful, though, since they output probabilities rather than a dichotomous prediction.
Visualizing predictions: Now that we have these models, let’s see a contestant’s probability of winning (conditioned on the model) evolves over the course of a game. I’m going to take the set of models that use the distance from lead predictor and apply them to a game from season 33.

Gavin takes the lead in the prediction model at the same time he takes the lead, in the middle of Double Jeopardy.
Here’s another one from season 33 where the prediction flips towards the end of the game:

The highest probability of winning is assigned to whoever is in the lead, which reflects the logic of the simple reference model.
Next steps: I think a significant shortcoming of the approach I took here is that I fit completely separate models for each question; they aren’t connected in any way, and so they don’t have any “memory” of how each contestant has performed previously in the game (except via their current score), or in prior games. Perhaps there’s a way to incorporate some ideas from partial pooling models to share strength between questions. Or maybe a model could be built that estimates a latent “ability” score for each participant, conditioned on their previous performance. A bonus of this would be that the winners ability score could be fed in to their next game, as a form of prior information about how well the contestant will do. Doing this in a Bayesian framework seems like a good choice.
I think there are also a few things that could be done to improve performance in the endgame. Right now the models don’t take into account how much money is still available. Incorporating this should help, especially in the end game when there isn’t very much money still on the board. It could also be used to find runaway scores, where one contestant has more money than is possible for a competitor to gain. We could also build a model for predicting the Final Jeopardy bets, so the end game model could have a better understanding of how likely an upset will be.
Finally, I’d also be interested in changing the goal slightly to predict winners in terms of Coryat score, which I’m sure would perform better since the uncertainty of daily doubles and the Final Jeopardy wager would be removed.
Source code: The source code for this analysis is on Github: https://github.com/herbps10/jeopardy