From Twitter:
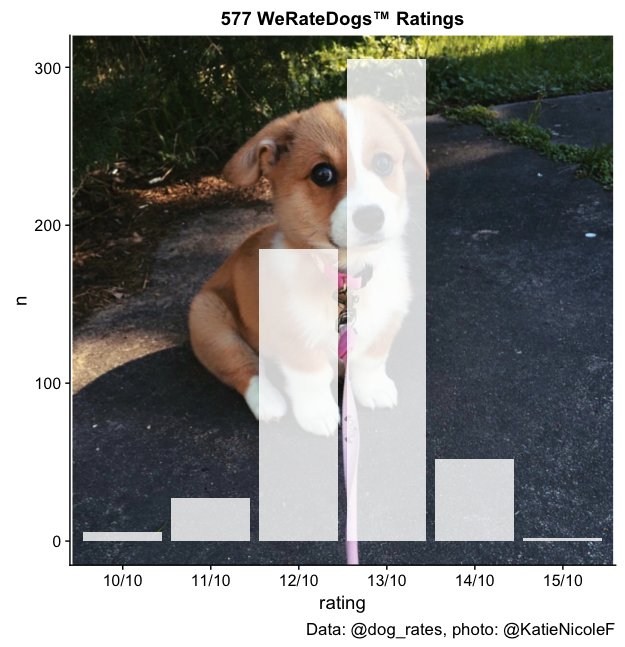
The most common rating for dogs from @dog_rates is 13/10. A few are 15/10 but all dogs deserve that rating in my opinion. Pictured with Ellie (12/10) from @KatieNicoleF. pic.twitter.com/B46rRDSCRY
— Herb Susmann (@herbps10) February 3, 2018
Here’s the R code I used to generate the histogram:
library(rtweet)
library(tidyverse)
library(stringr)
library(cowplot)
library(grid)
library(jpeg)

g <- rasterGrob(readJPEG("ellie.jpg"), interpolate = TRUE)

tmls <- get_timelines("dog_rates", n = 3200)

ratings <- tmls %>%
  filter(str_detect(text, "t.co")) %>%
  filter(!str_detect(text, "^RT")) %>%
  filter(!str_detect(text, "Here's a little more info on Dew")) %>%
  mutate(rating = map(text, str_extract_all, "1[0-5]/10"),
         rating = map(rating, `[[`, 1)) %>%
  unnest(rating) %>%
  count(rating)

ggplot(ratings, aes(x = rating, y = n)) +
  annotation_custom(g) +
  geom_col(fill = "white", alpha = 0.8) +
  labs(caption = "Data: @dog_rates, photo: @KatieNicoleF",
       title = "577 WeRateDogs™ Ratings")
The R code is also available as a gist.