Gun dealers in the U.S. are required to conduct instant background checks before selling weapons to individuals. The FBI provides data for the number of these background checks performed by month/year, which serves as a proxy for the total number of gun sales in the U.S.
I brought the data into R for a quick and dirty analysis, with the intent of finding spikes in background checks around major events.
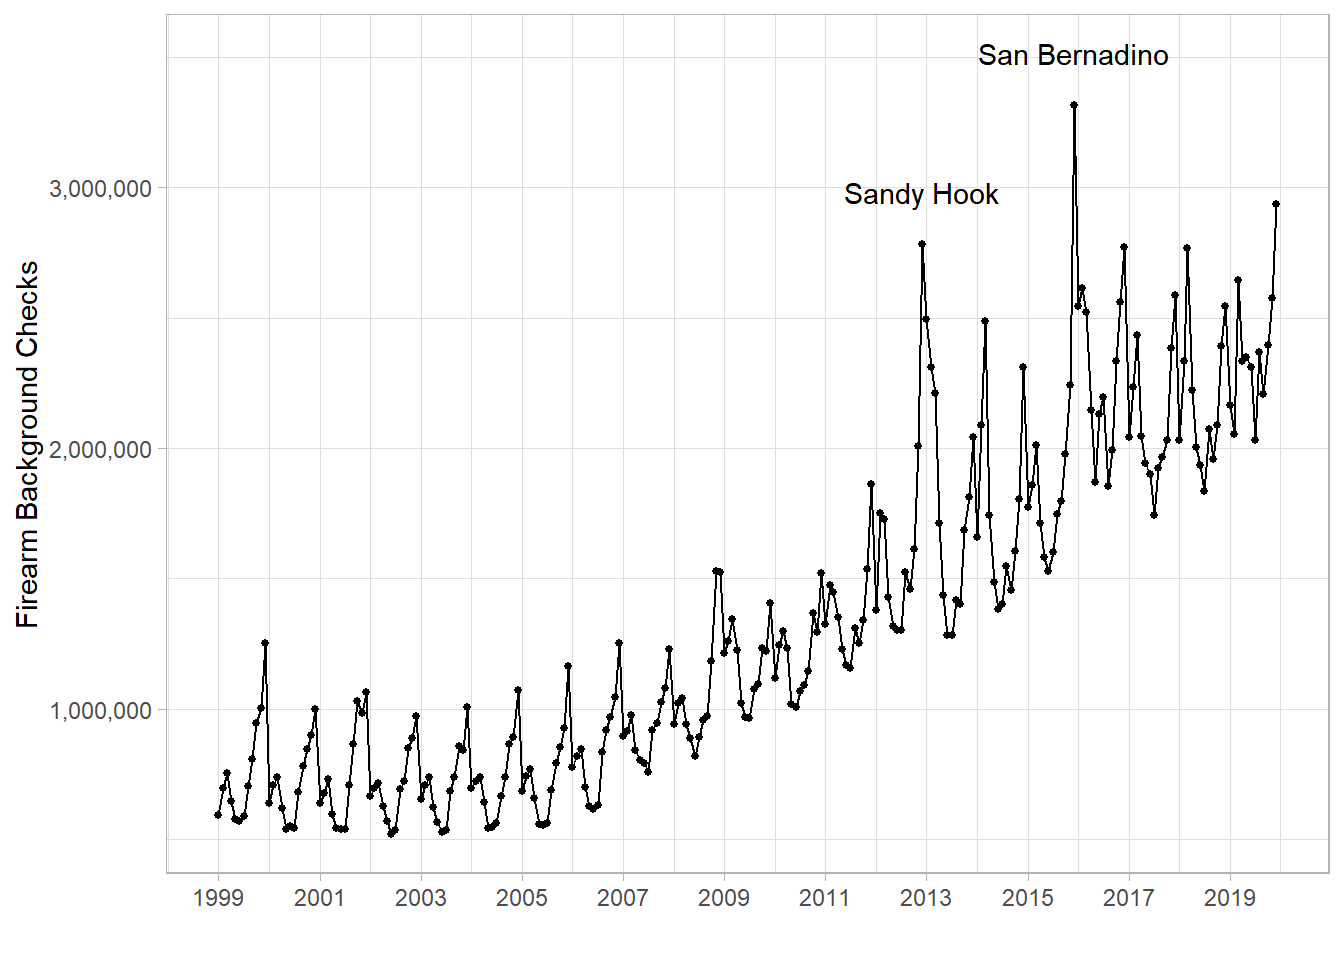
First, let’s take a look raw data. There are a few obvious spikes in the later years, which correspond to the Sandy Hook (December 2012) and San Bernadino (December 2015) shootings.
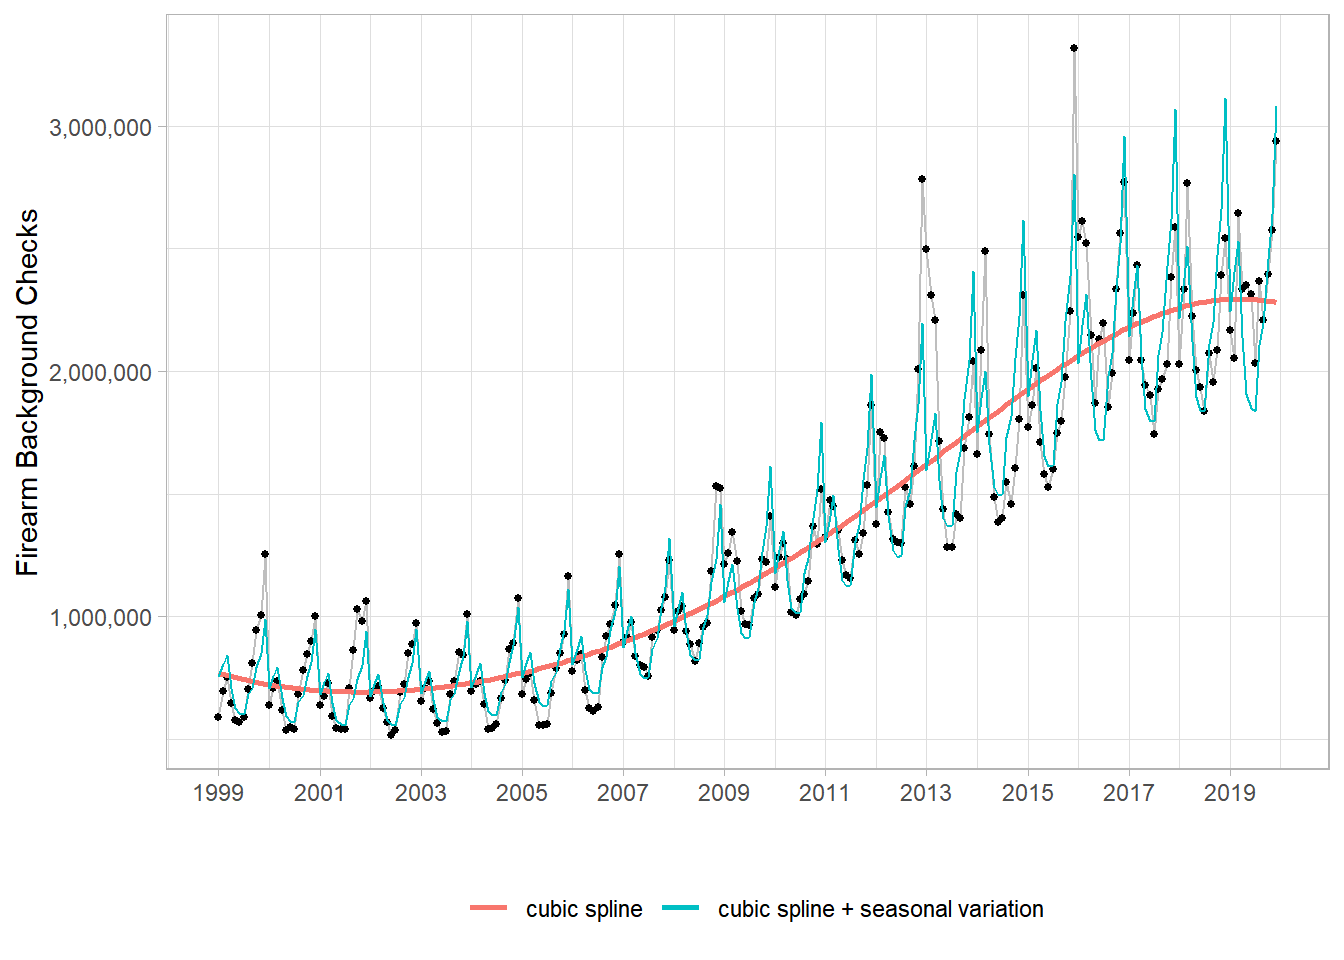
Next, I fit a negative binomial generalized linear model that accounts for an overall trend using a 3rd order cubic spline and monthly seasonal variation:
model <- MASS::glm.nb(value ~ bs(date) + month, dat)Even such a simple model does a decent job fitting the data, although it gets much worse in later years as the variance in the data increases:
More interesting is the plot of the residuals from the model, which show spikes in background checks that aren’t accounted for by the model. This makes a couple of other peaks jump out that are correlated with notable events, like 9/11 and Obama’s election:
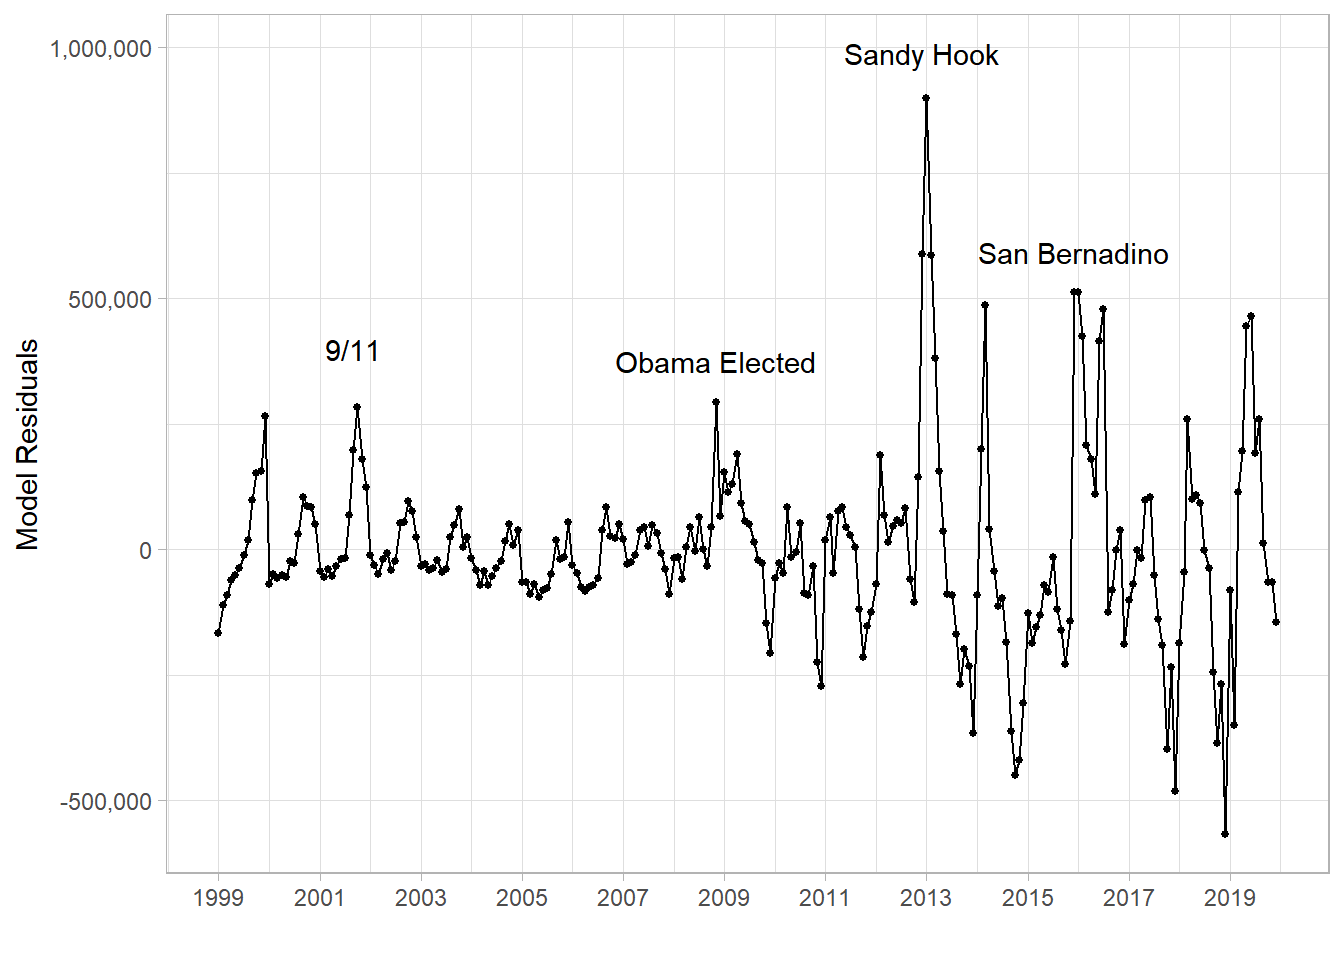
There are a few other peaks that I don’t have explanations for, like in late 1999 and in the beginning of 2014.
I think it’s interesting how the model residuals let us see spikes in background checks that we couldn’t see in the raw data. The tradeoff is that the model residuals are conditional on the model choice; choosing a different model might lead to a different plot. If we want to answer the question “were there spikes in gun background checks”, we now have to condition our conclusions on that model choice, which complicates interpretation.